
Example Results
Example
We provided an example input file and the corresponding results of the input for instruction. We will show you what the Result page looks like and how to interpret the outputs of PhaBOX.
Result page
Below we will show you how to interpret the results of PhaBOX online. We also provided this result page for you to play at any time. You can search the jobID with PhaBOX-EXAMPLE or click on the link.
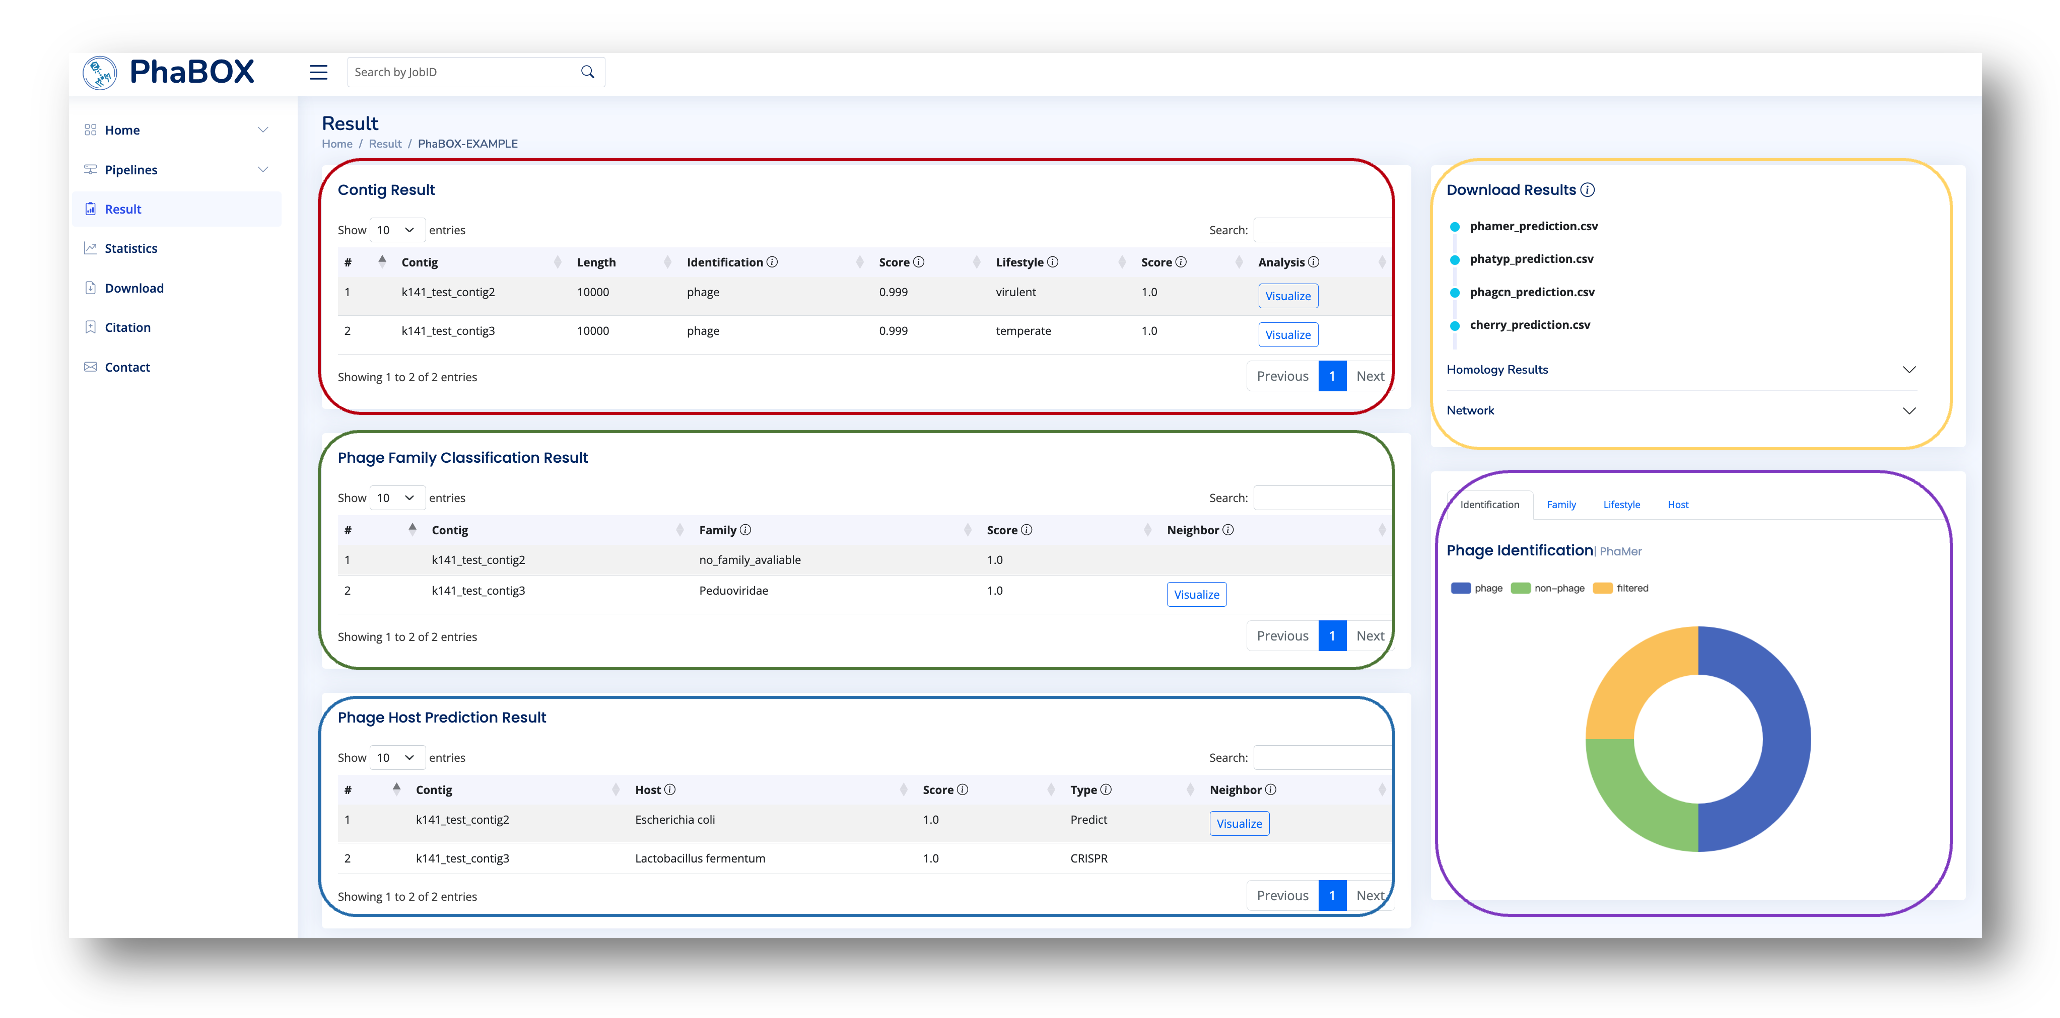
Overall, there are four parts on this example page (Red box/Green box/Blue box/Yellow box/Purple box). Each part refers to differnt functions as listed below:
-
Red box : The prediction results and the homology visualization of the contigs.
-
Green box : The taxonomy classification results and the visualization of the contig in the knowledge graph, which is a sequence similarity-based network used in PhaGCN. Detailed information can be found in Wiki -> PhaGCN.
-
Blue box : The host prediction results and the visualization of the contig in the multimodal graph used in CHERRY. The multimodal graph consists of different types of phage-phage and phage-bacteria relationship information. Detailed information can be found in Wiki -> CHERRY.
-
Yellow box : The downloadable files containing the complete predictions (in csv format). In addition, we provided the intermediate files, such as the alignment results and the whole network (knowledge graph/multimodal graph), for the user if they are of interest.
-
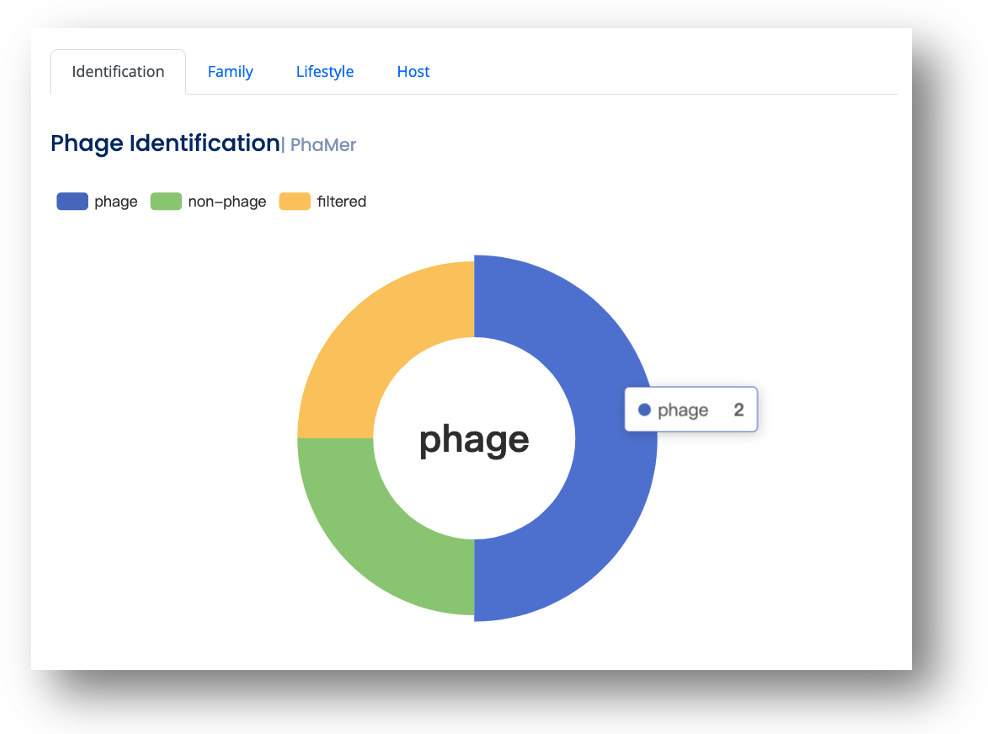
Purple box : Pie chart of the prediction results.
When checking the results, feel free to move your cursor onto the icon as shown below to narrow the meaning of the columns:
Then, we will detail each part in the following sections:
The prediction results and the homology visualization of the contigs will be shown in this table. Please note that running different programs will lead to different prediction results in this table according to the task of the program. For example, PhaGCN will show taxonomy classification results, while PhaTYP will show lifestyle prediction results.
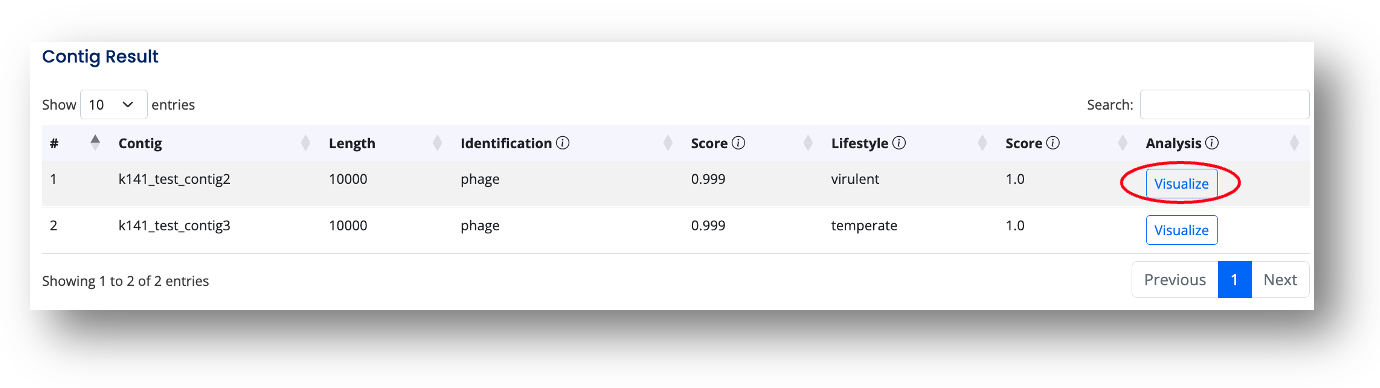
You can click to view the predicted proteins in this contig and the protein homology against the protein cluster database.
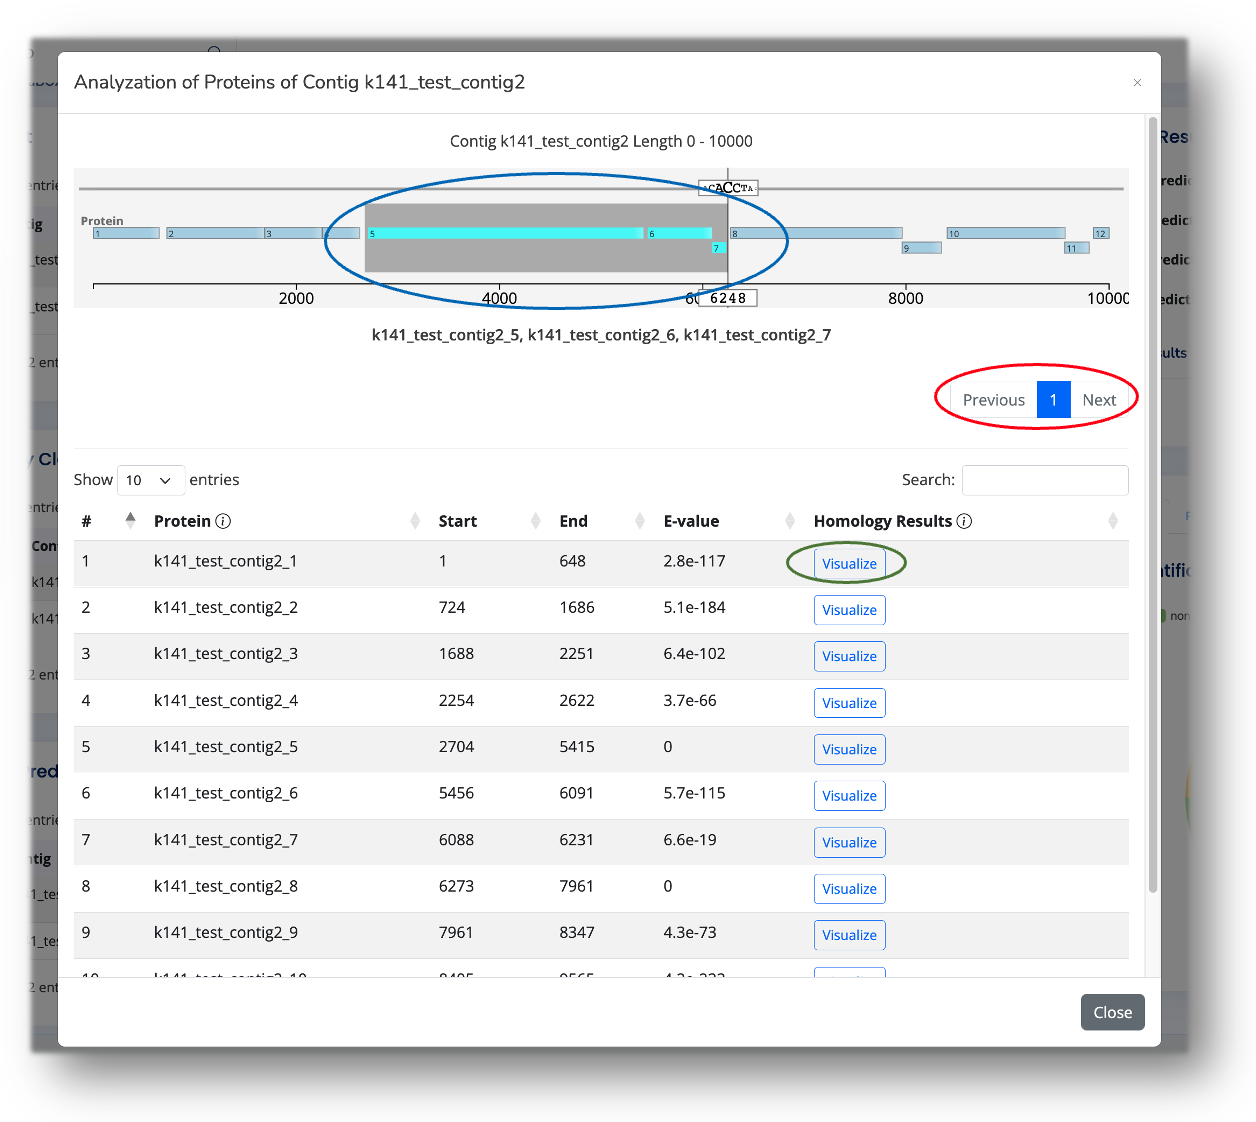
If the length of the contig is longer than 10kbp, we will separate it into several segments. Click on the button in the red circle to browse the whole sequence. You can also select a region of interest on the contig to show the ID/name of the predicted proteins. The homology results will be shown when you click on in the green circle. An example is attached below:
The taxonomy classification results and the visualization of the contig in the knowledge graph will be shown in this table. The knowledge consists of two types of phage-phage edges, which estimate the similarity between sequences (detailed information can be found in Wiki -> PhaGCN). Please note that this table will be shown if you run the PhaBOX or PhaGCN.
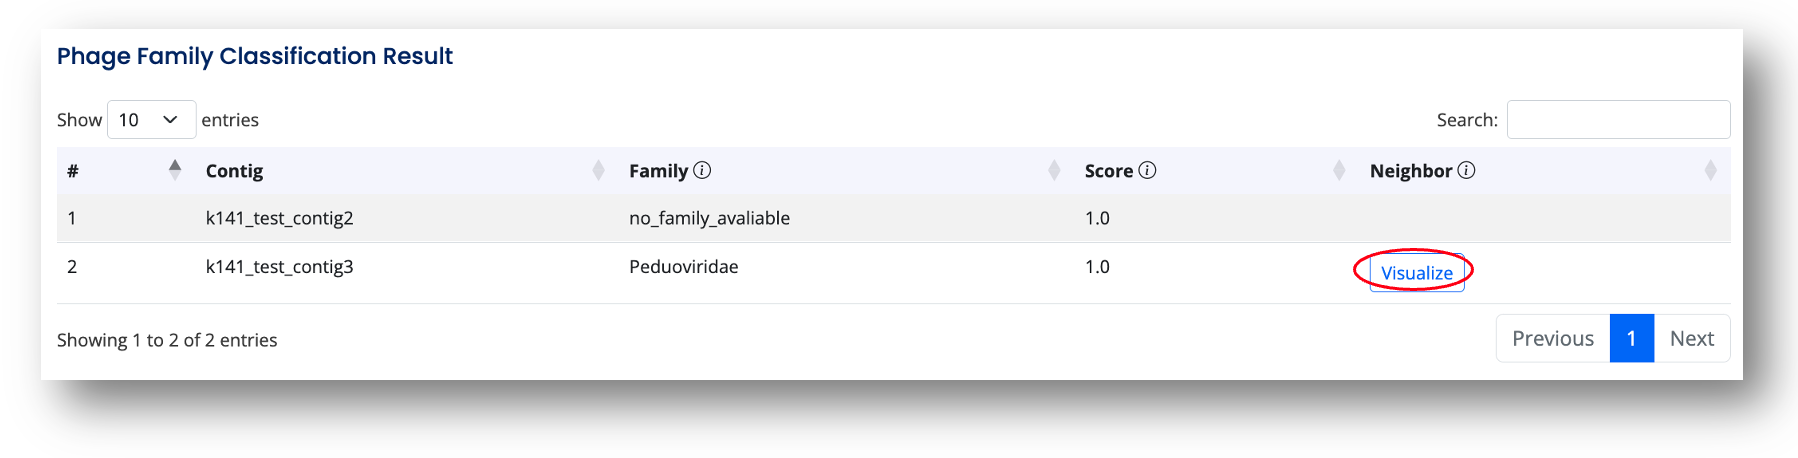
According to the latest ICTV 2022, many phage family taxa are removed, and half of the phages are not assigned to any family. Thus, if the contig has a strong relationship/similarity/alignment identity with these phages, we will assign no_family_avaliable for them. If the program predicts the family taxa for the contig, it will also show the evidence of generating the prediction. Click on in the red circle, and it will show the one-step neighborhood (the closest relationships) of the contigs. An example is attached below:
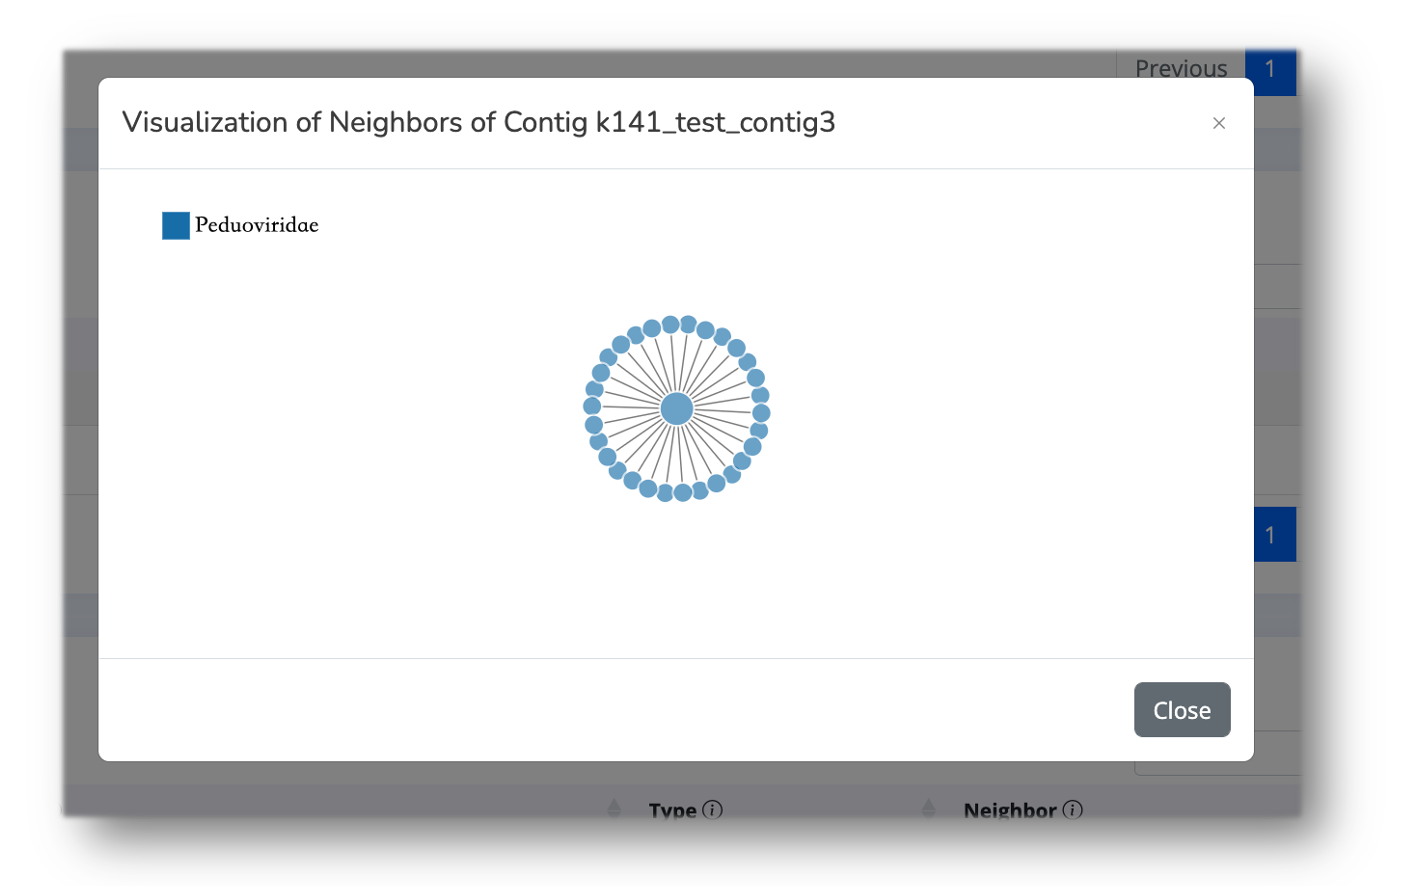
The node in the center represents the contig that you choose to visualize. The contig nodes will be larger, and the reference nodes will be smaller when visualizing the knowledge graph. Feel free to move your cursor on the node to see more detailed information about the nodes.
In addition, we provided the complete network for the user to download and visualize locally. They are in the Download Results -> Network on the TOP-RIGHT of the Results page. We will introduce them in the later section (Yellow Box).
The host prediction results and the visualization of the contig in the multimodal graph will be shown in this table. The multimodal graph consist several types of phage-phage edges and phage-bacteria edges, which estimate the relationship between sequences (detailed information can be found in Wiki -> CHERRY). Please noted that this table will be shown only if you run the PhaBOX or CHERRY.
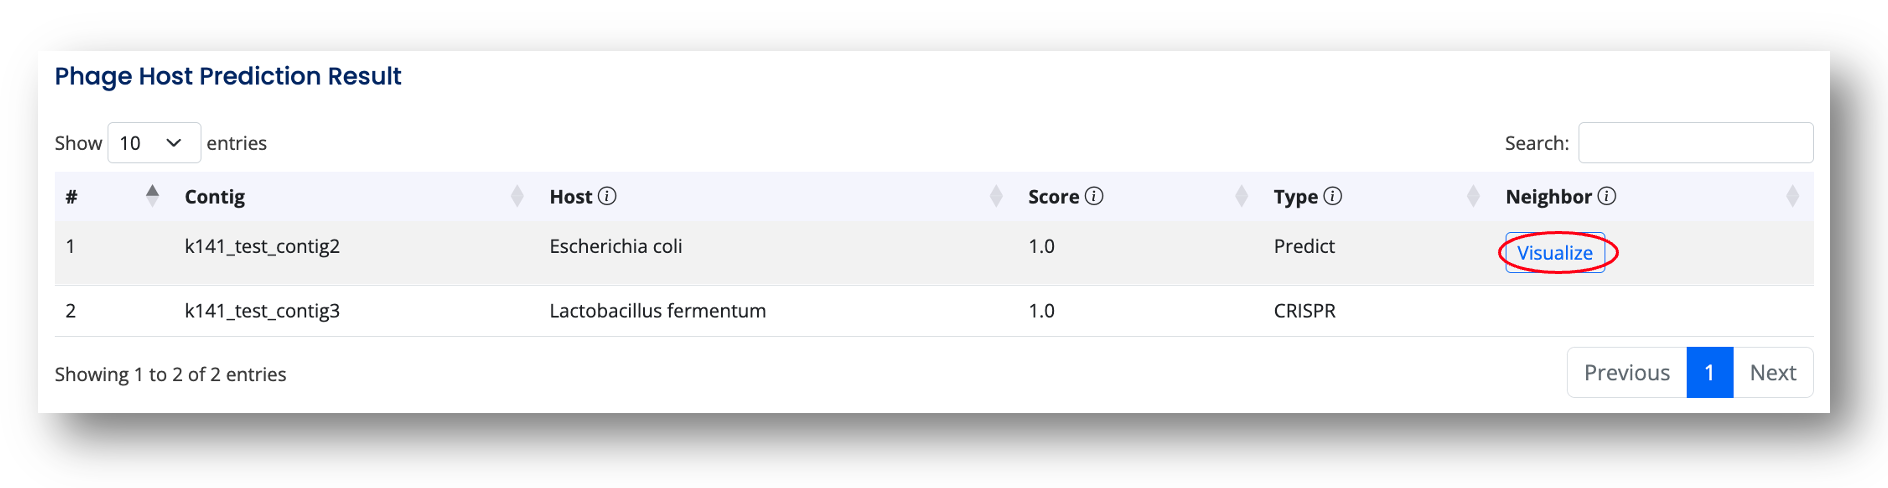
There are two types of prediction. If the prediction is made by the CRISPR database, then there is no visualization available. Otherwise, the user can check the one-step neighborhood (the closest relationships) of the contigs. An example is attached below:
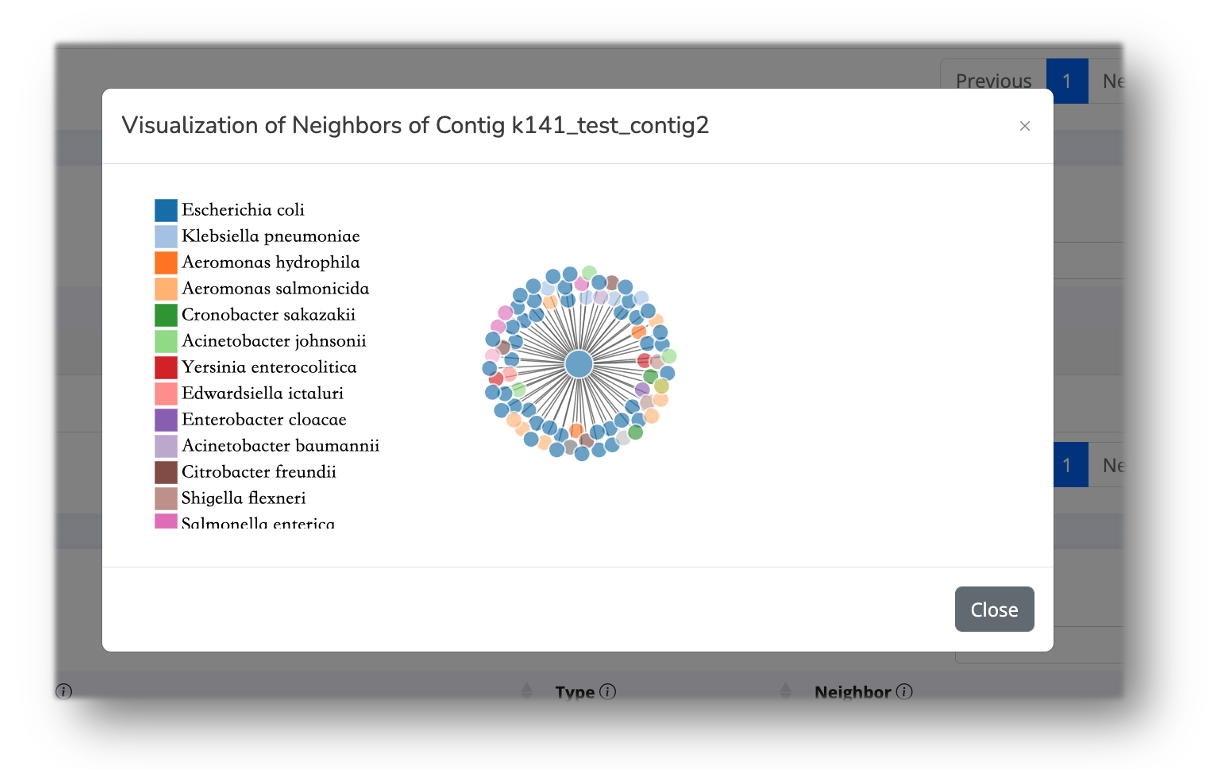
The node in the center represents the contig that you choose to visualize. The contig nodes will be in a larger size, and the reference nodes (including bacteria nodes and phage nodes) will be in a smaller size when visualizing the knowledge graph. Feel free to move your cursor on the node to see more detailed information about the nodes.
In addition, we provided the complete network for the user to download and visualize locally. They are in the Download Results -> Network on the TOP-RIGHT of the Results page. We will introduce them in the later section (Yellow Box).
Below is the whole picture of the Download Results. The Blue part is the complete prediction results made by the program. The Yellow and Red parts are intermediate results. Please note that the results of the Network are only available when you run PhaBOX, PhaGCN, and CHERRY.

-
Prediction Results : the output of the task-specific program. The header will include contig names, predictions, and scores.
-
Homology Results : the protein homology results. We provide the predicted proteins and their alignment results for the user to download.
-
Network : The network files (xxx_node.csv and xxx_edge.csv) are standard input formats for most network-based visualization tools, such as Gephi, Cytoscape and networkD3. Users can use them to visualize the complete knowledge graph or multimodal graph locally.
Pie chart of the prediction results. You can move your cursor on the pie chart to show the corresponding category. An example is attached below:
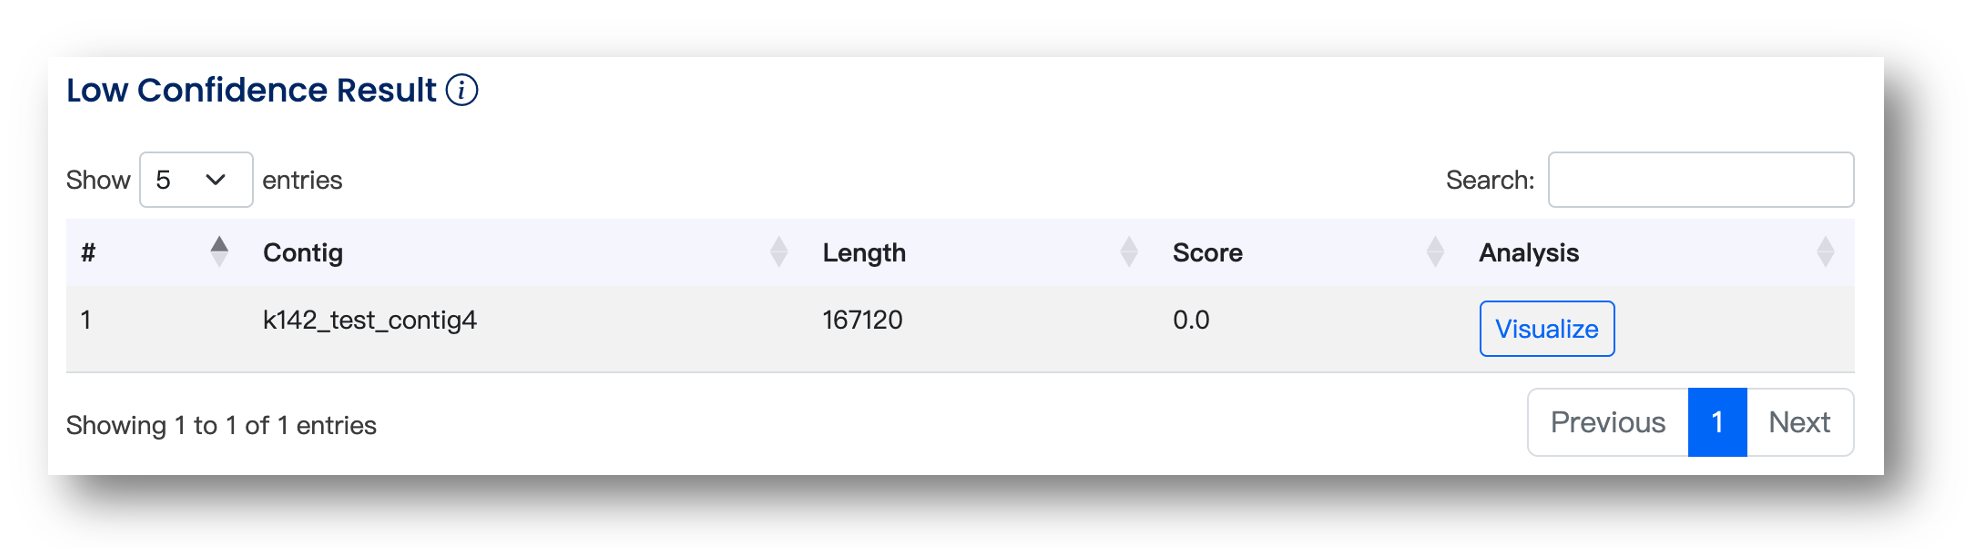
Low confidence result
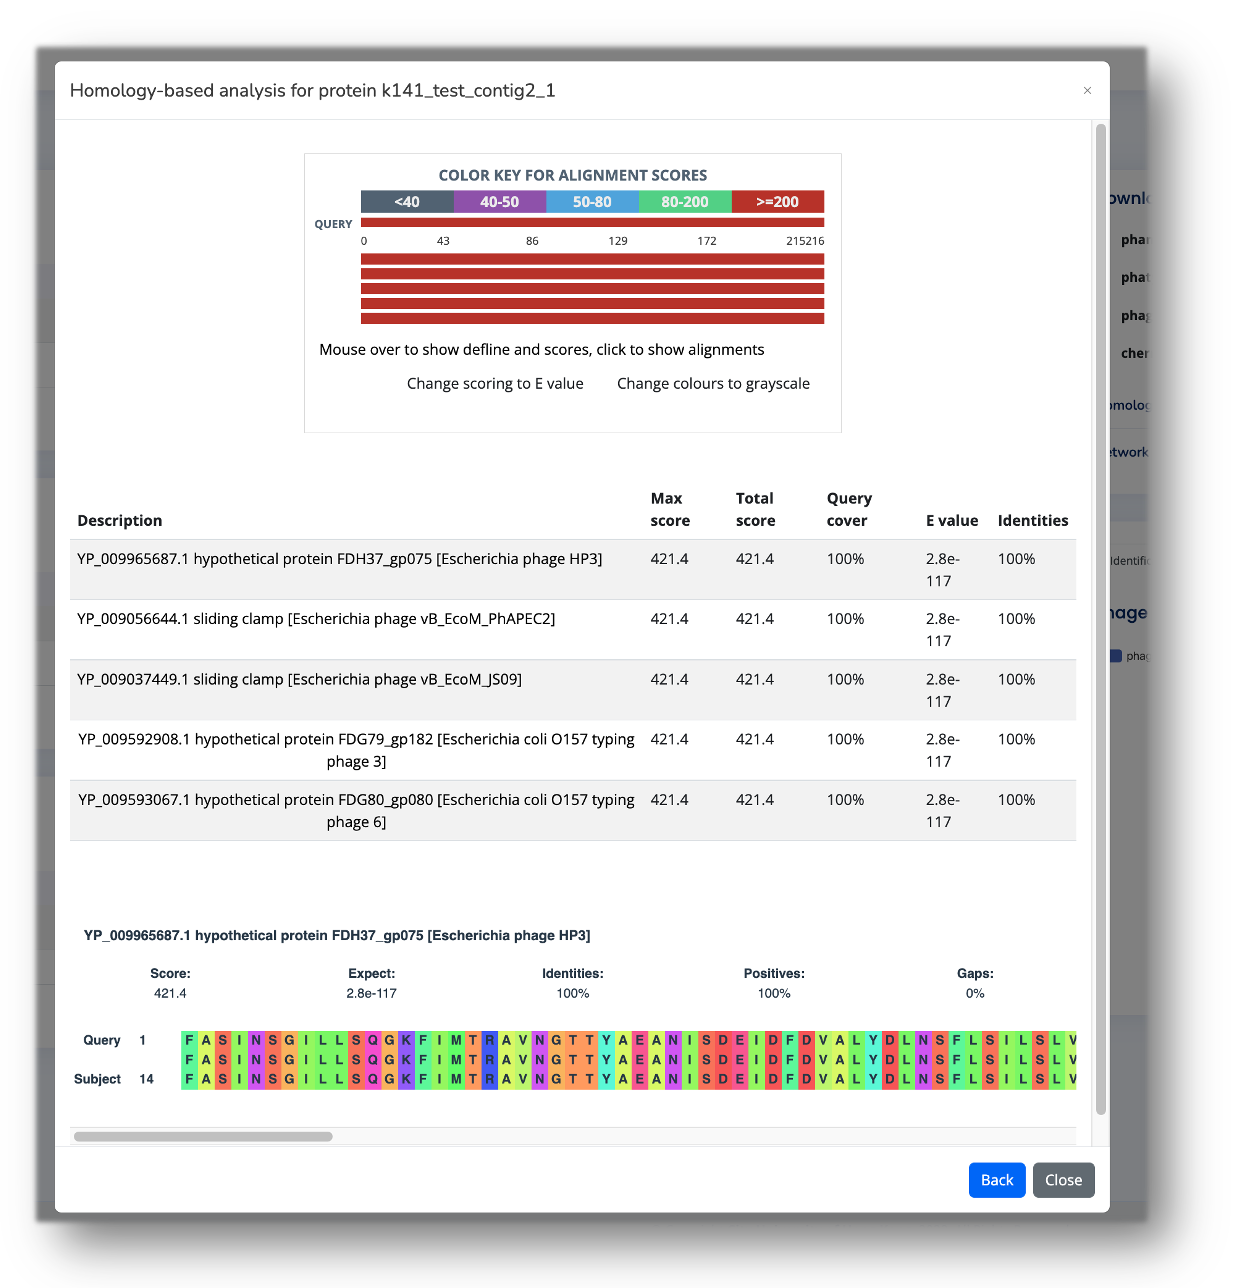
For query contigs with alignments to phage proteins, although they are not predicted as phages by PhaMer, we provide users with visualizations for further gene searching. The results are in Low Confidence Results.
There are several reasons causing the low confidence result:
Assembly errors
Common regions/proteins shared by phages and bacteria
Poteintial prophages
Etc.
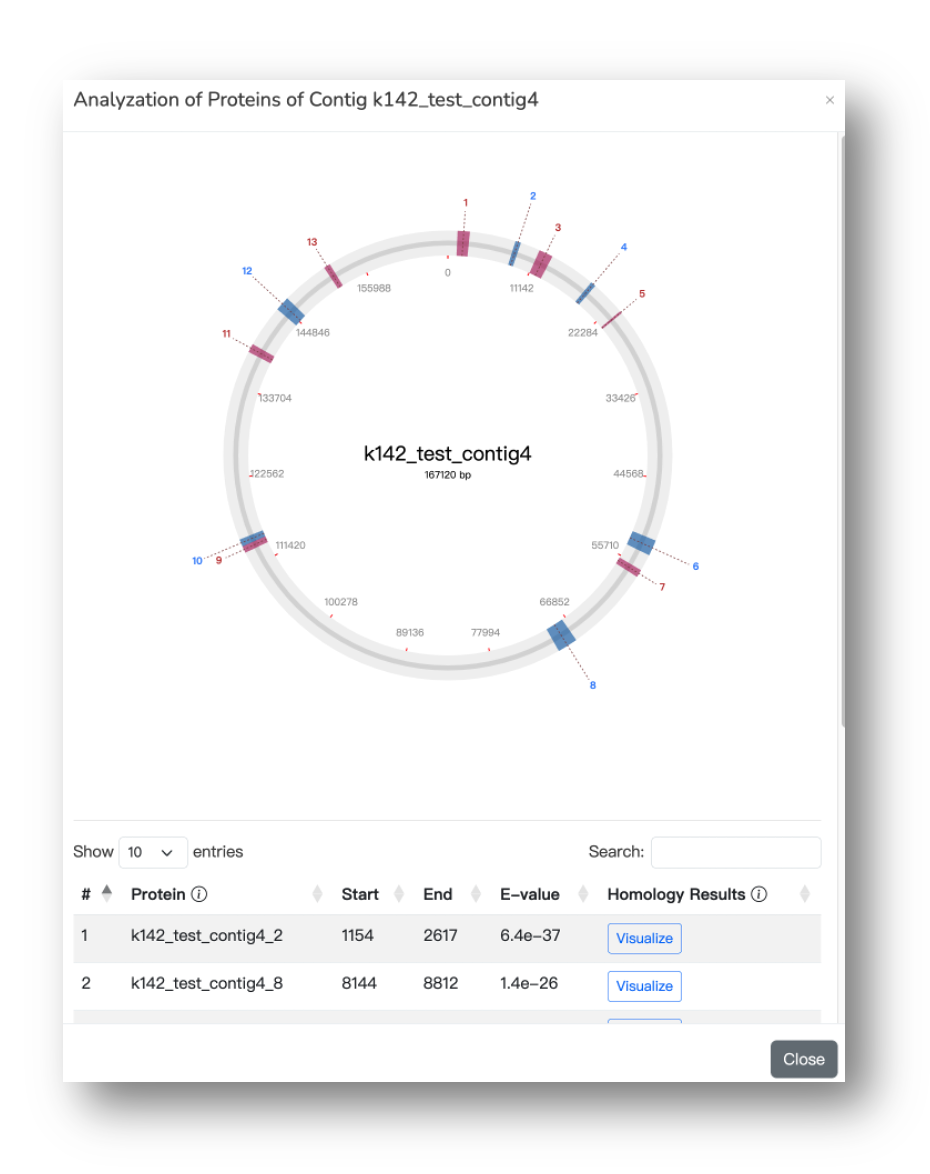
The visualization of the protein alignments is attached below for reference:
Output format
The predictions are stored in csv files. Below, we listed the detail explainations of the header in the csv.
PhaMer
Accession: the name or ID of the contigs. For example, if the header of the contig is k141_contig1. Then, the name or ID will be 141_contig1.
-
Length : the length of the contig.
-
Pred : the identification results of PhaMer. There are three possible predictions:
Phage
Non-phage
Filtered (the length of the sequence is shorter than the threshold)
-
Score : range from [0, 1]. This decimal number denotes the probability to be a phage sequence predicted by PhaMer. The higher the value, the high the probability of the contig being a phage sequence.
PhaTYP
Accession: the name or ID of the contigs. For example, if the header of the contig is k141_contig1. Then, the name or ID will be 141_contig1.
-
Length : the length of the contig.
-
Pred : lifestyle classification results predicted by PhaTYP, there are four kinds of results:
- Temperate phage
- Virulent phage
- Unkonwn (Insufficient evidence to predict lifestyle)
- Filtered (the length of the sequence is shorter than the threshold)
-
Score : the decimal number denotes the probability to be a temperate/virulent phage predicted by PhaTYP. The range of the score is [0, 1].
PhaGCN
Accession: the name or ID of the contigs. For example, if the header of the contig is k141_contig1. Then, the name or ID will be 141_contig1.
-
Length : the length of the contig.
-
Pred : the family-level taxonomy classification results predicted by PhaGCN. There are four kinds of results:
Family taxa of the phage (supplied by ICTV 2022)
Unnamed_family (phages that do not have family taxa in ICTV 2022)
Unkonwn (Insufficient evidence to predict taxa)
Filtered (the length of the sequence is shorter than the threshold)
In the case of 'No_family_avaliable', we will output the accession of the most similar phage for reference. The score will be the identity*coverage.
-
Score : the decimal number denotes the probability to be a phage in the family predicted by PhaGCN.
CHERRY
Accession: the name or ID of the contigs. For example, if the header of the contig is k141_contig1. Then, the name or ID will be 141_contig1.
-
Length : the length of the contig.
-
Pred : Host prediction results predicted by CHERRY, there are three kinds of results:
The name of the host
Unkonwn (Insufficient evidence to predict host)
Filtered (the length of the sequence is shorter than the threshold)
-
Score : the decimal number denotes the probability of a bacteria being the host of the query contig predicted by CHERRY.
Type: there are two kinds of prediction type:
-
'CRISPRs' denotes that the results is annotated by CRISPRs database
-
'Pred' dennotes that the result is annotated by computational predictions
-
When checking the results on our web server, feel free to move your cursor onto the icon as shown below to narrow the meaning of the header:
